Blog
MetricsWave Increases Event Limits Across All Plans

MetricsWave has just rolled out a significant update to its subscription plans, dramatically increasing the number of events you can track each month.
Meet MetricsWave: Your 100% Open-Source Analytics Platform

MetricsWave is now fully open-source! That means anyone—developers, businesses, or curious minds—can view, edit, and enhance the code. Whether you want to suggest new features, fix bugs, or simply explore how it works, the doors are wide open.
Connect your Stripe account!
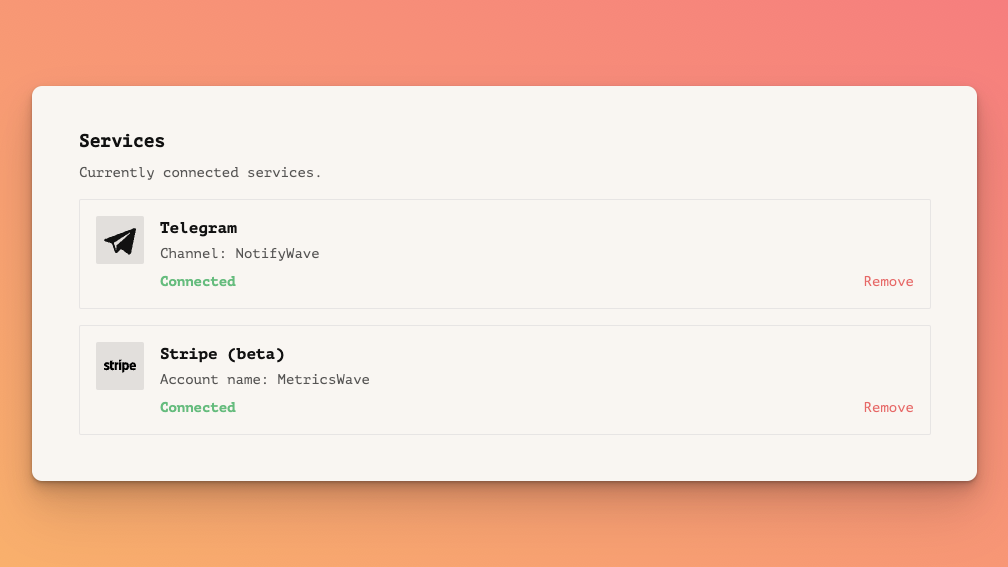
About a month ago, we introduce new money income events, and now keeping track of your income is even easier with Stripe accounts!
Know What Your Users are Doing
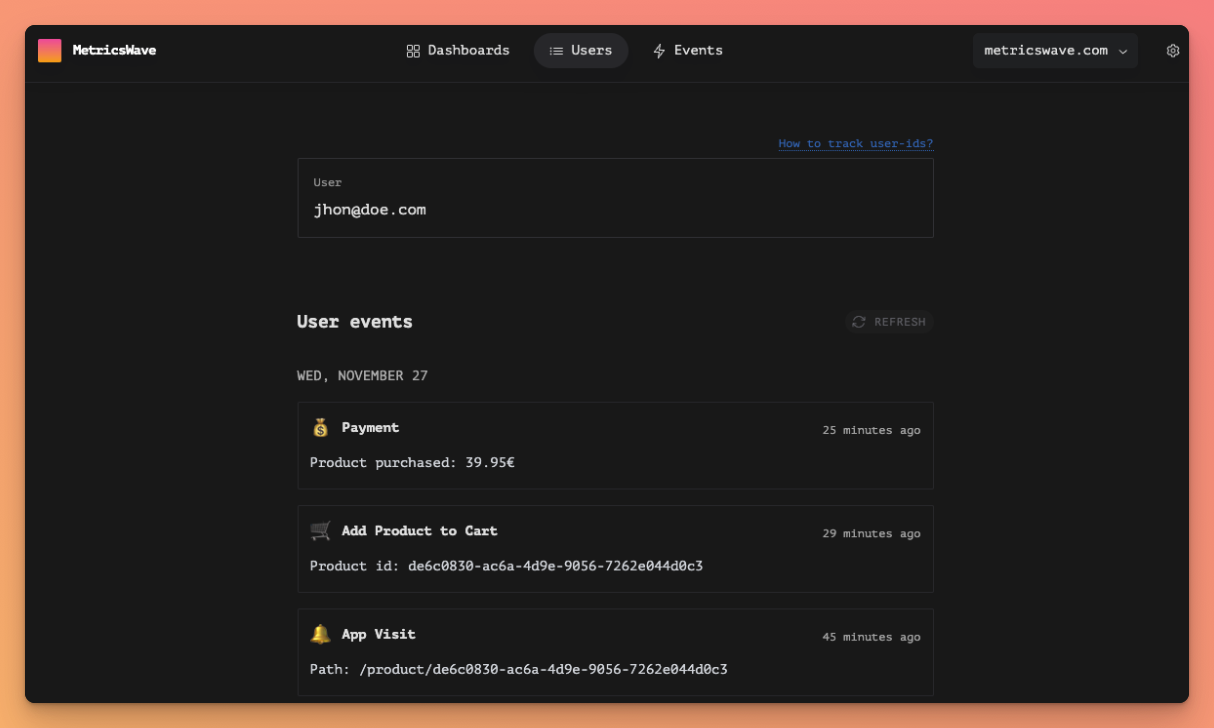
The new users section allows you to know exactly how your users use your application. Track where they click, what pages they view, the purchases they make and anything else relevant to make better decisions.
New number widget!
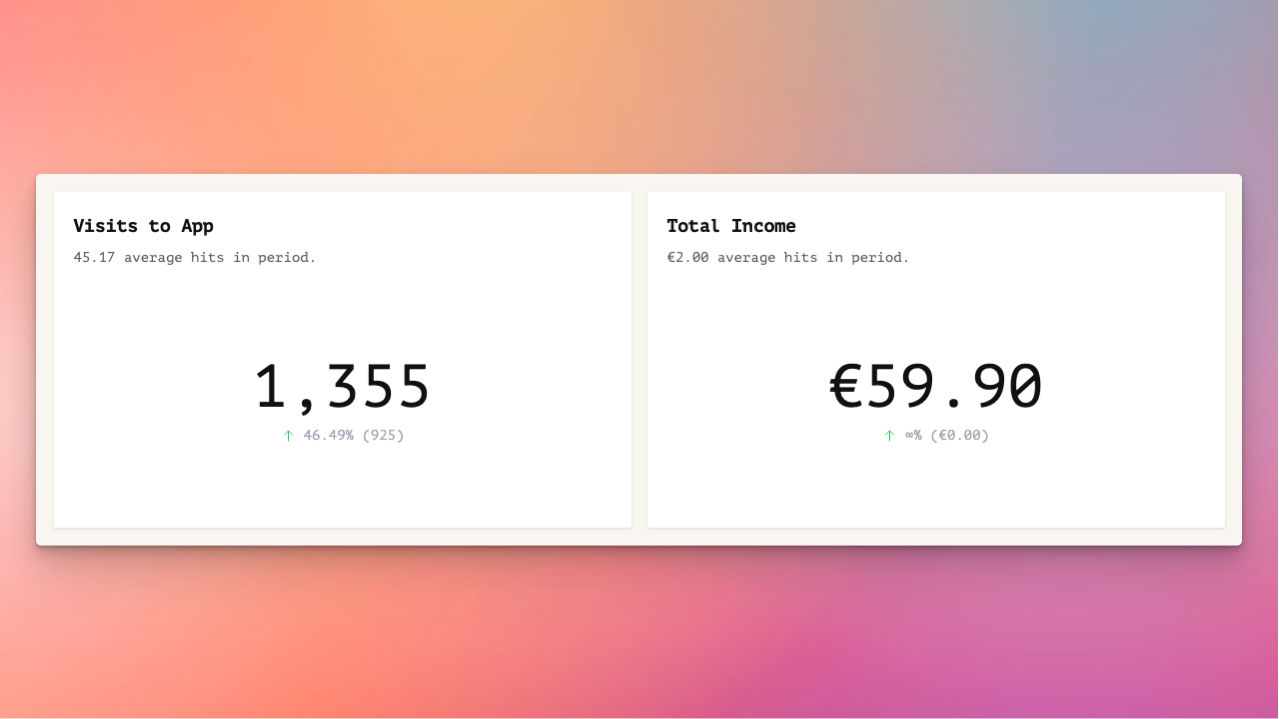
Display data in a direct, clear and concise way with the new Numbers widget. Amounts, visits, clics on a button, and everything else.
Money Income events just got released!
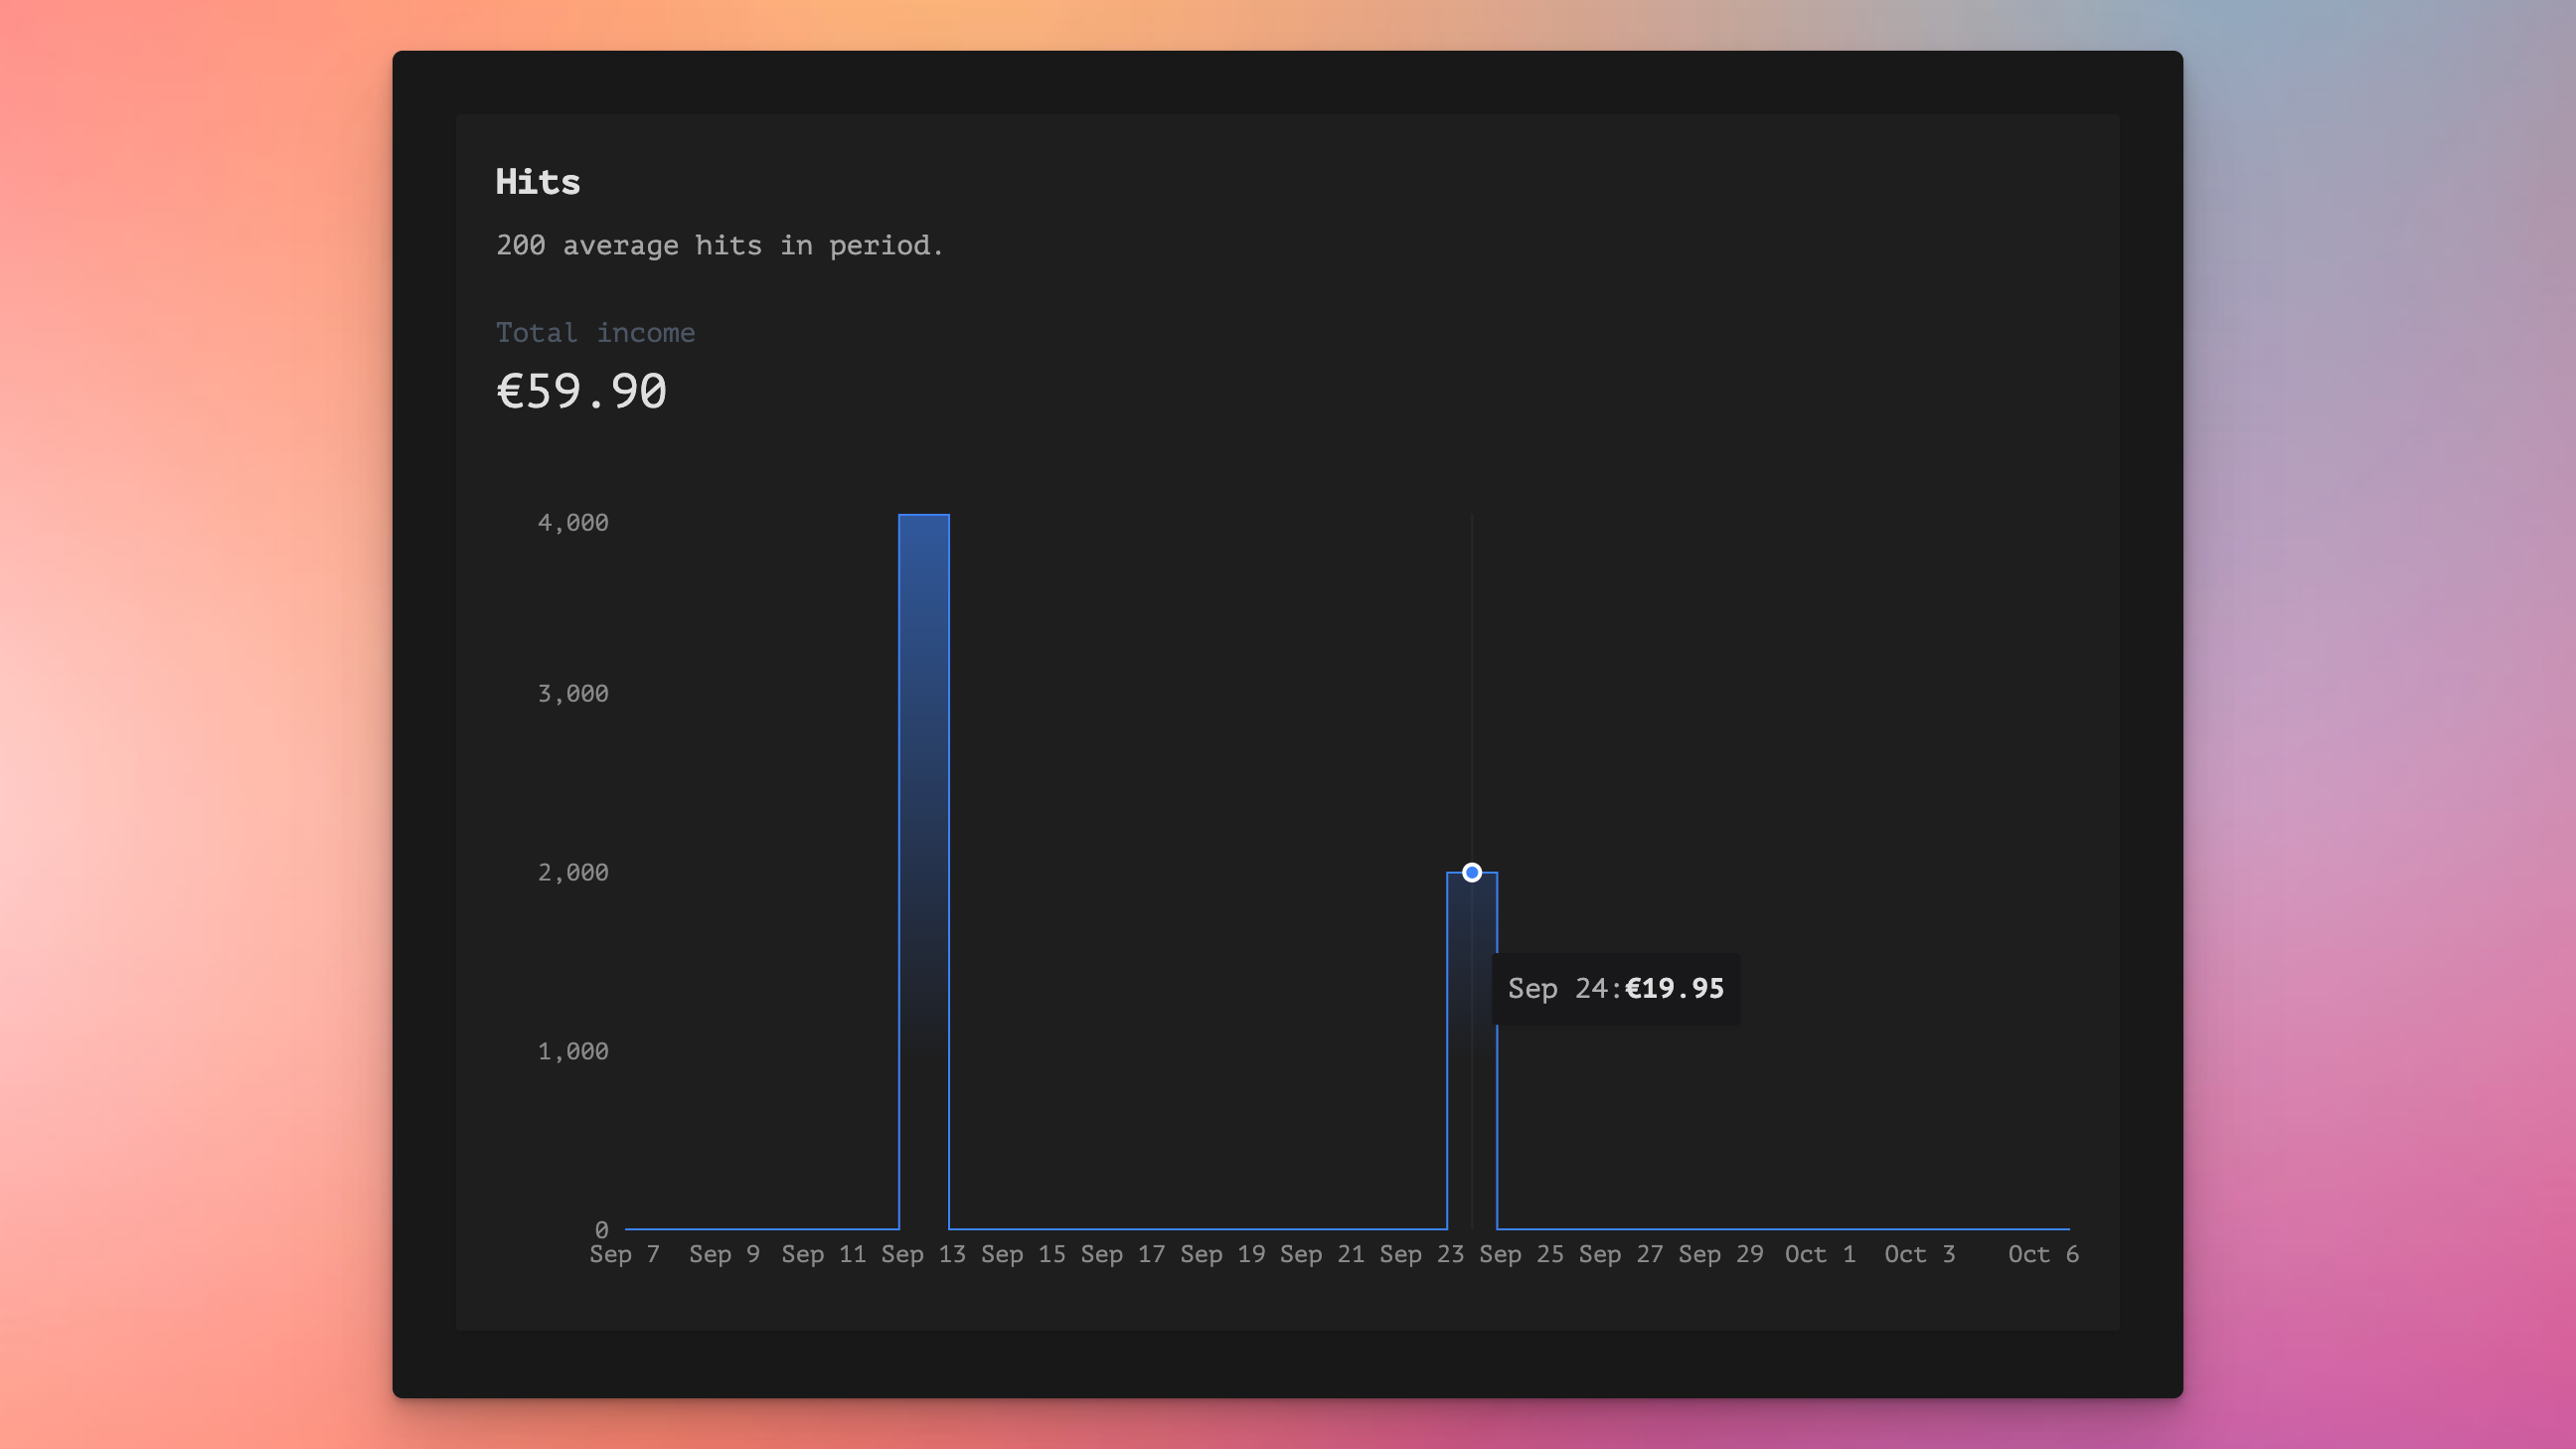
Understand how you are monetizing your project, how much money your subscriptions generate, optimize the process, and increase your revenue with new money income events.
Changelog: New date selector!
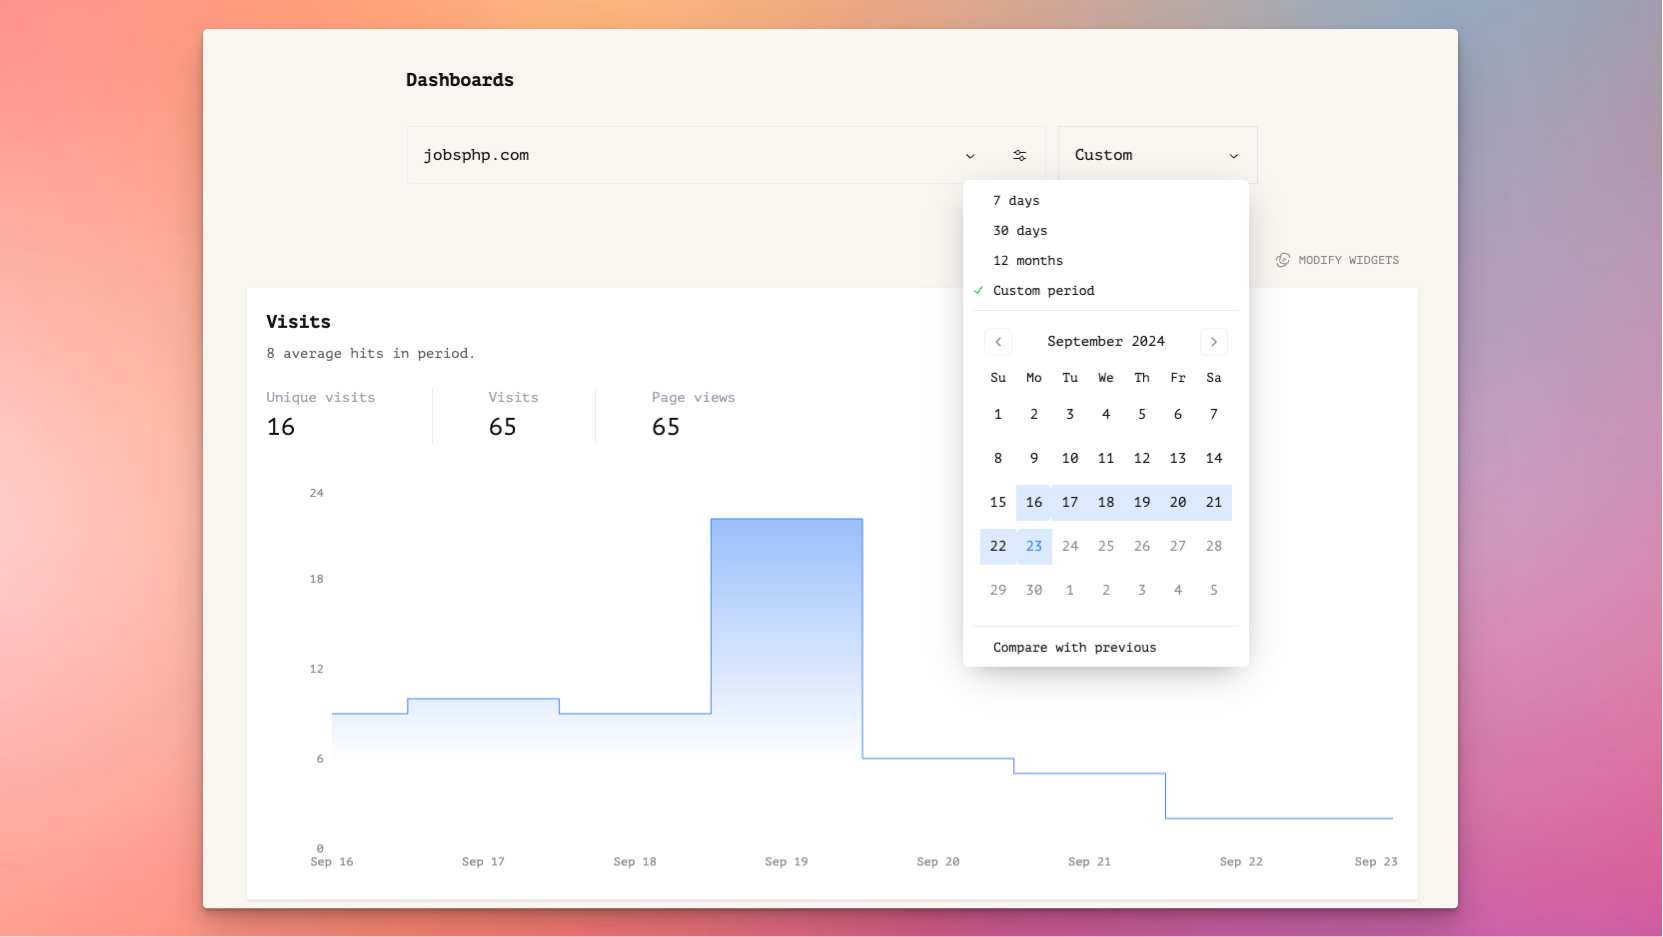
You were waiting for this, and here it is! Now you can select the exact date period you want, and of course, compare it with the previous period.
Changelog: Remove a site or leave a team
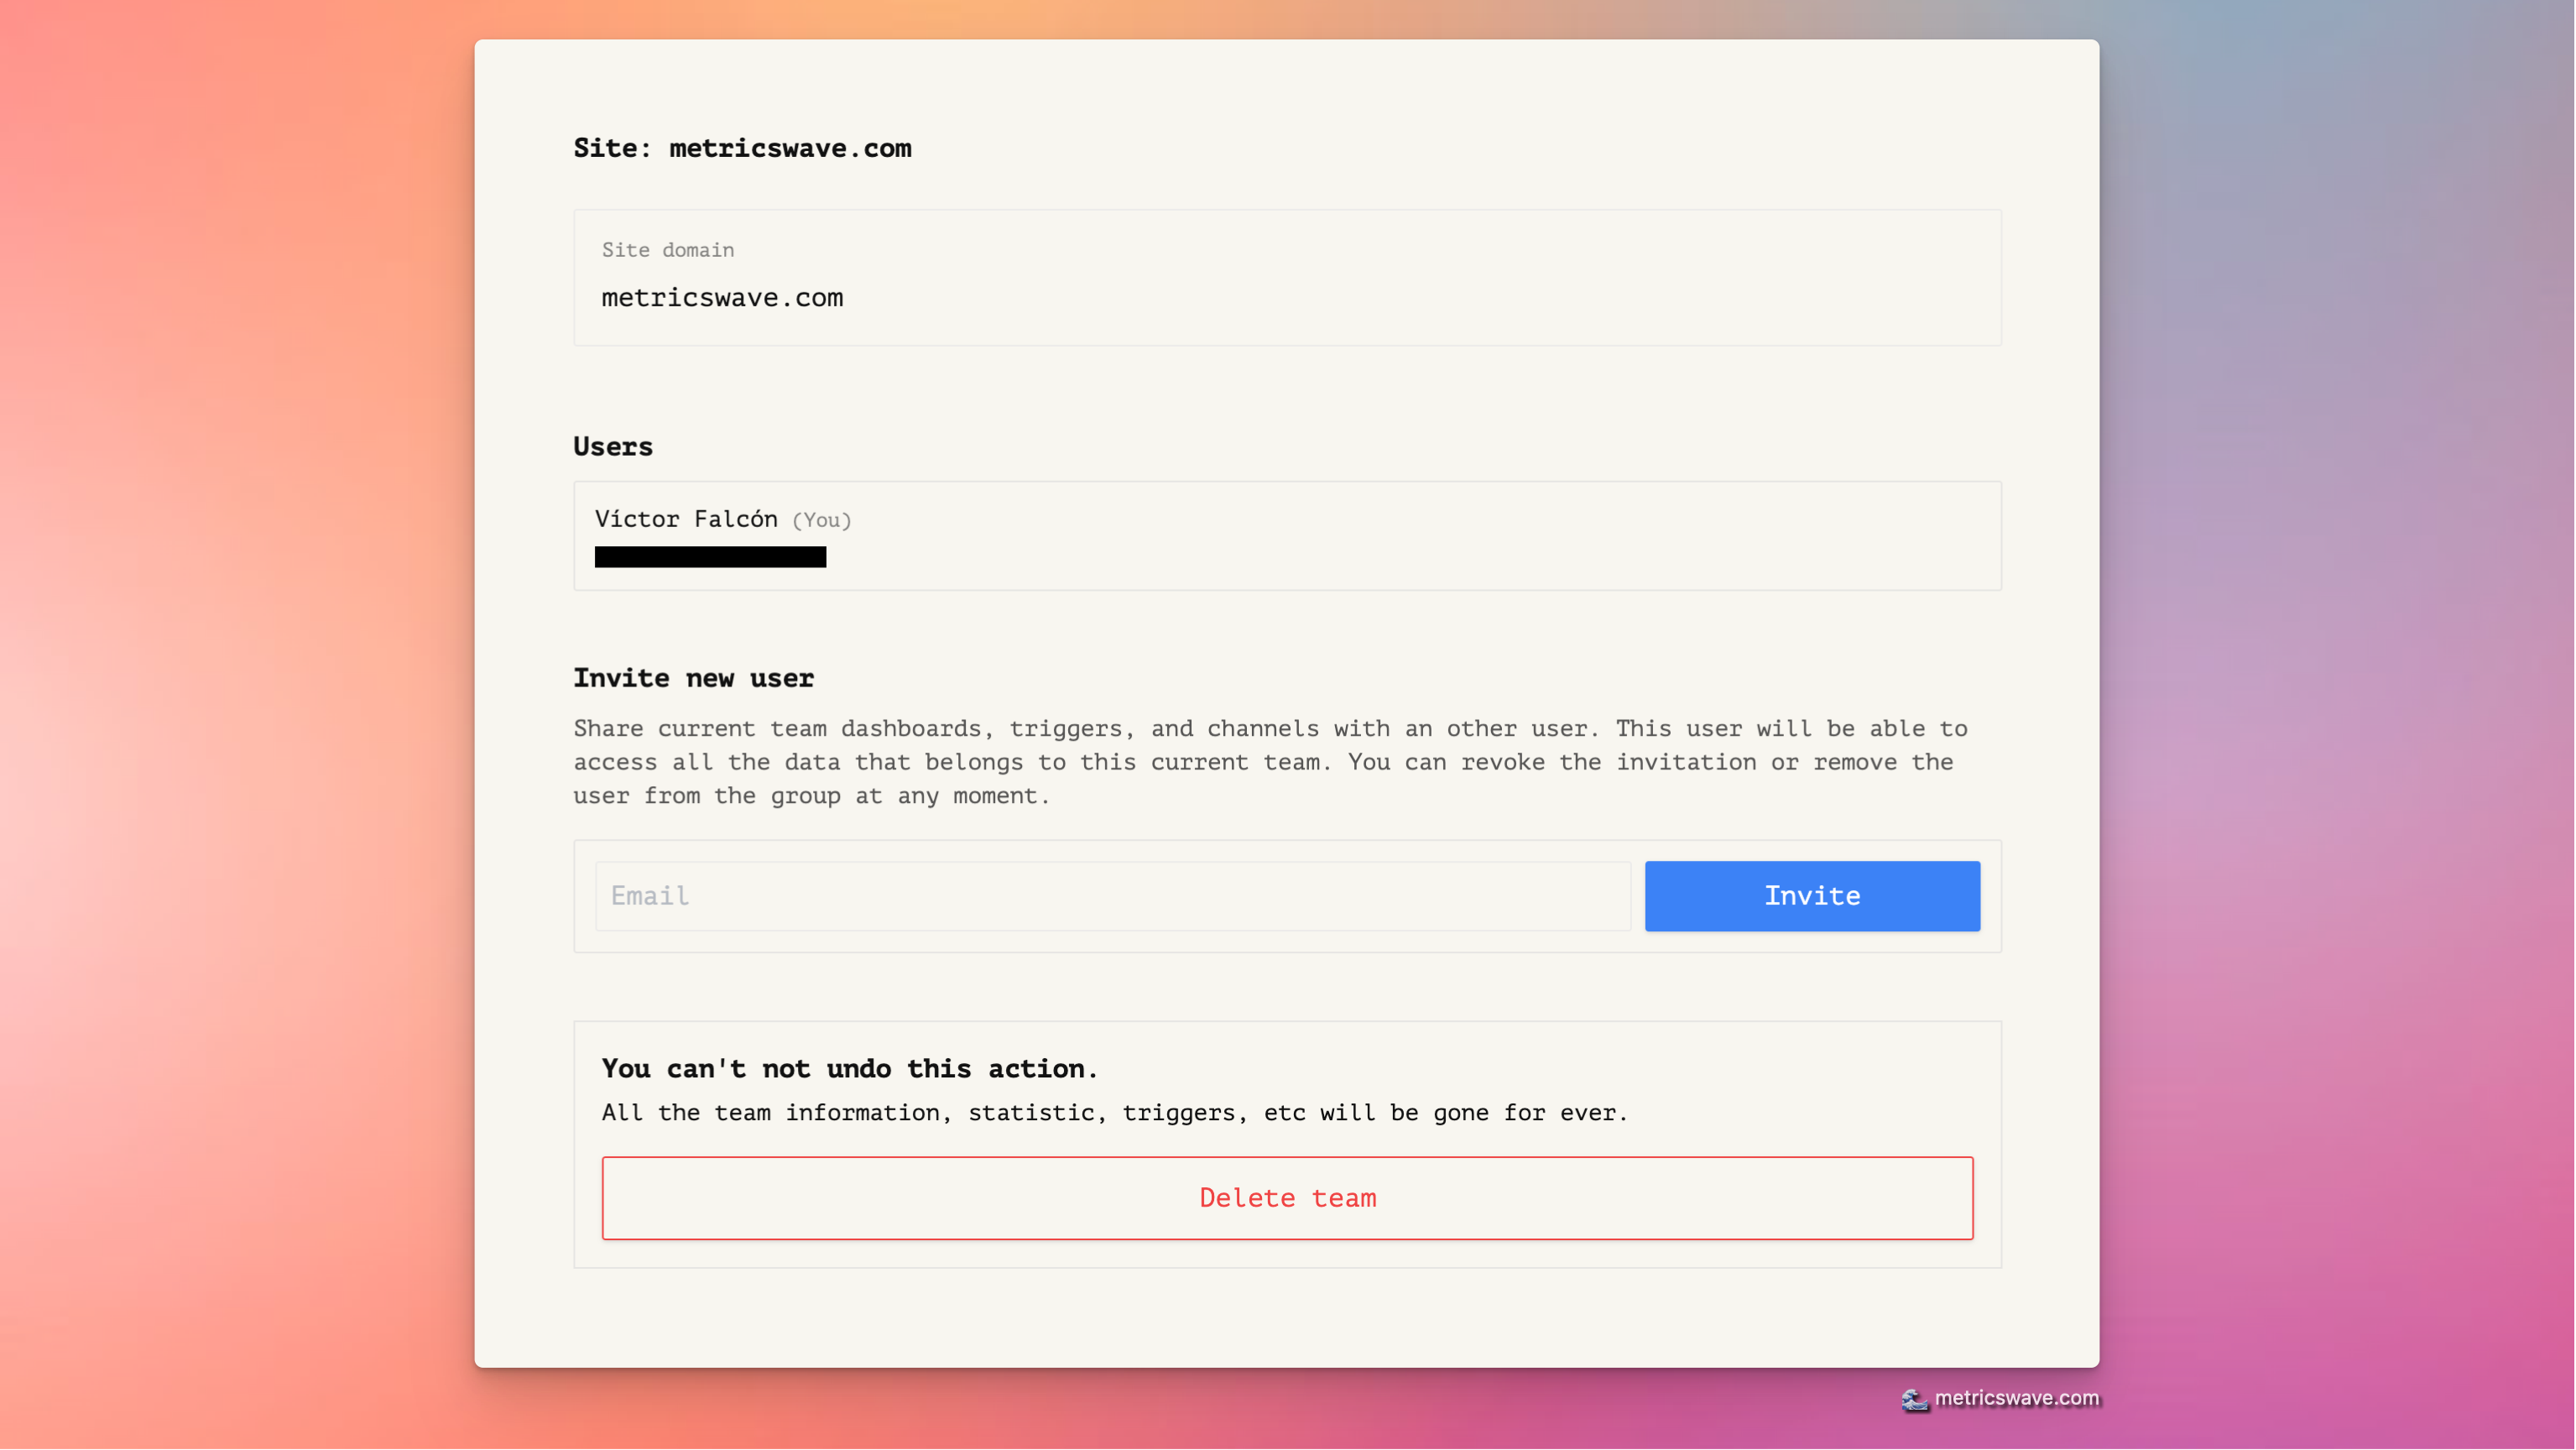
Since we added the team functionality 6 months ago there were two things missing. Delete a site, and also leave a site by yourself. They are now here to stay.
How we improve loading speed from 20-30 seconds to instant
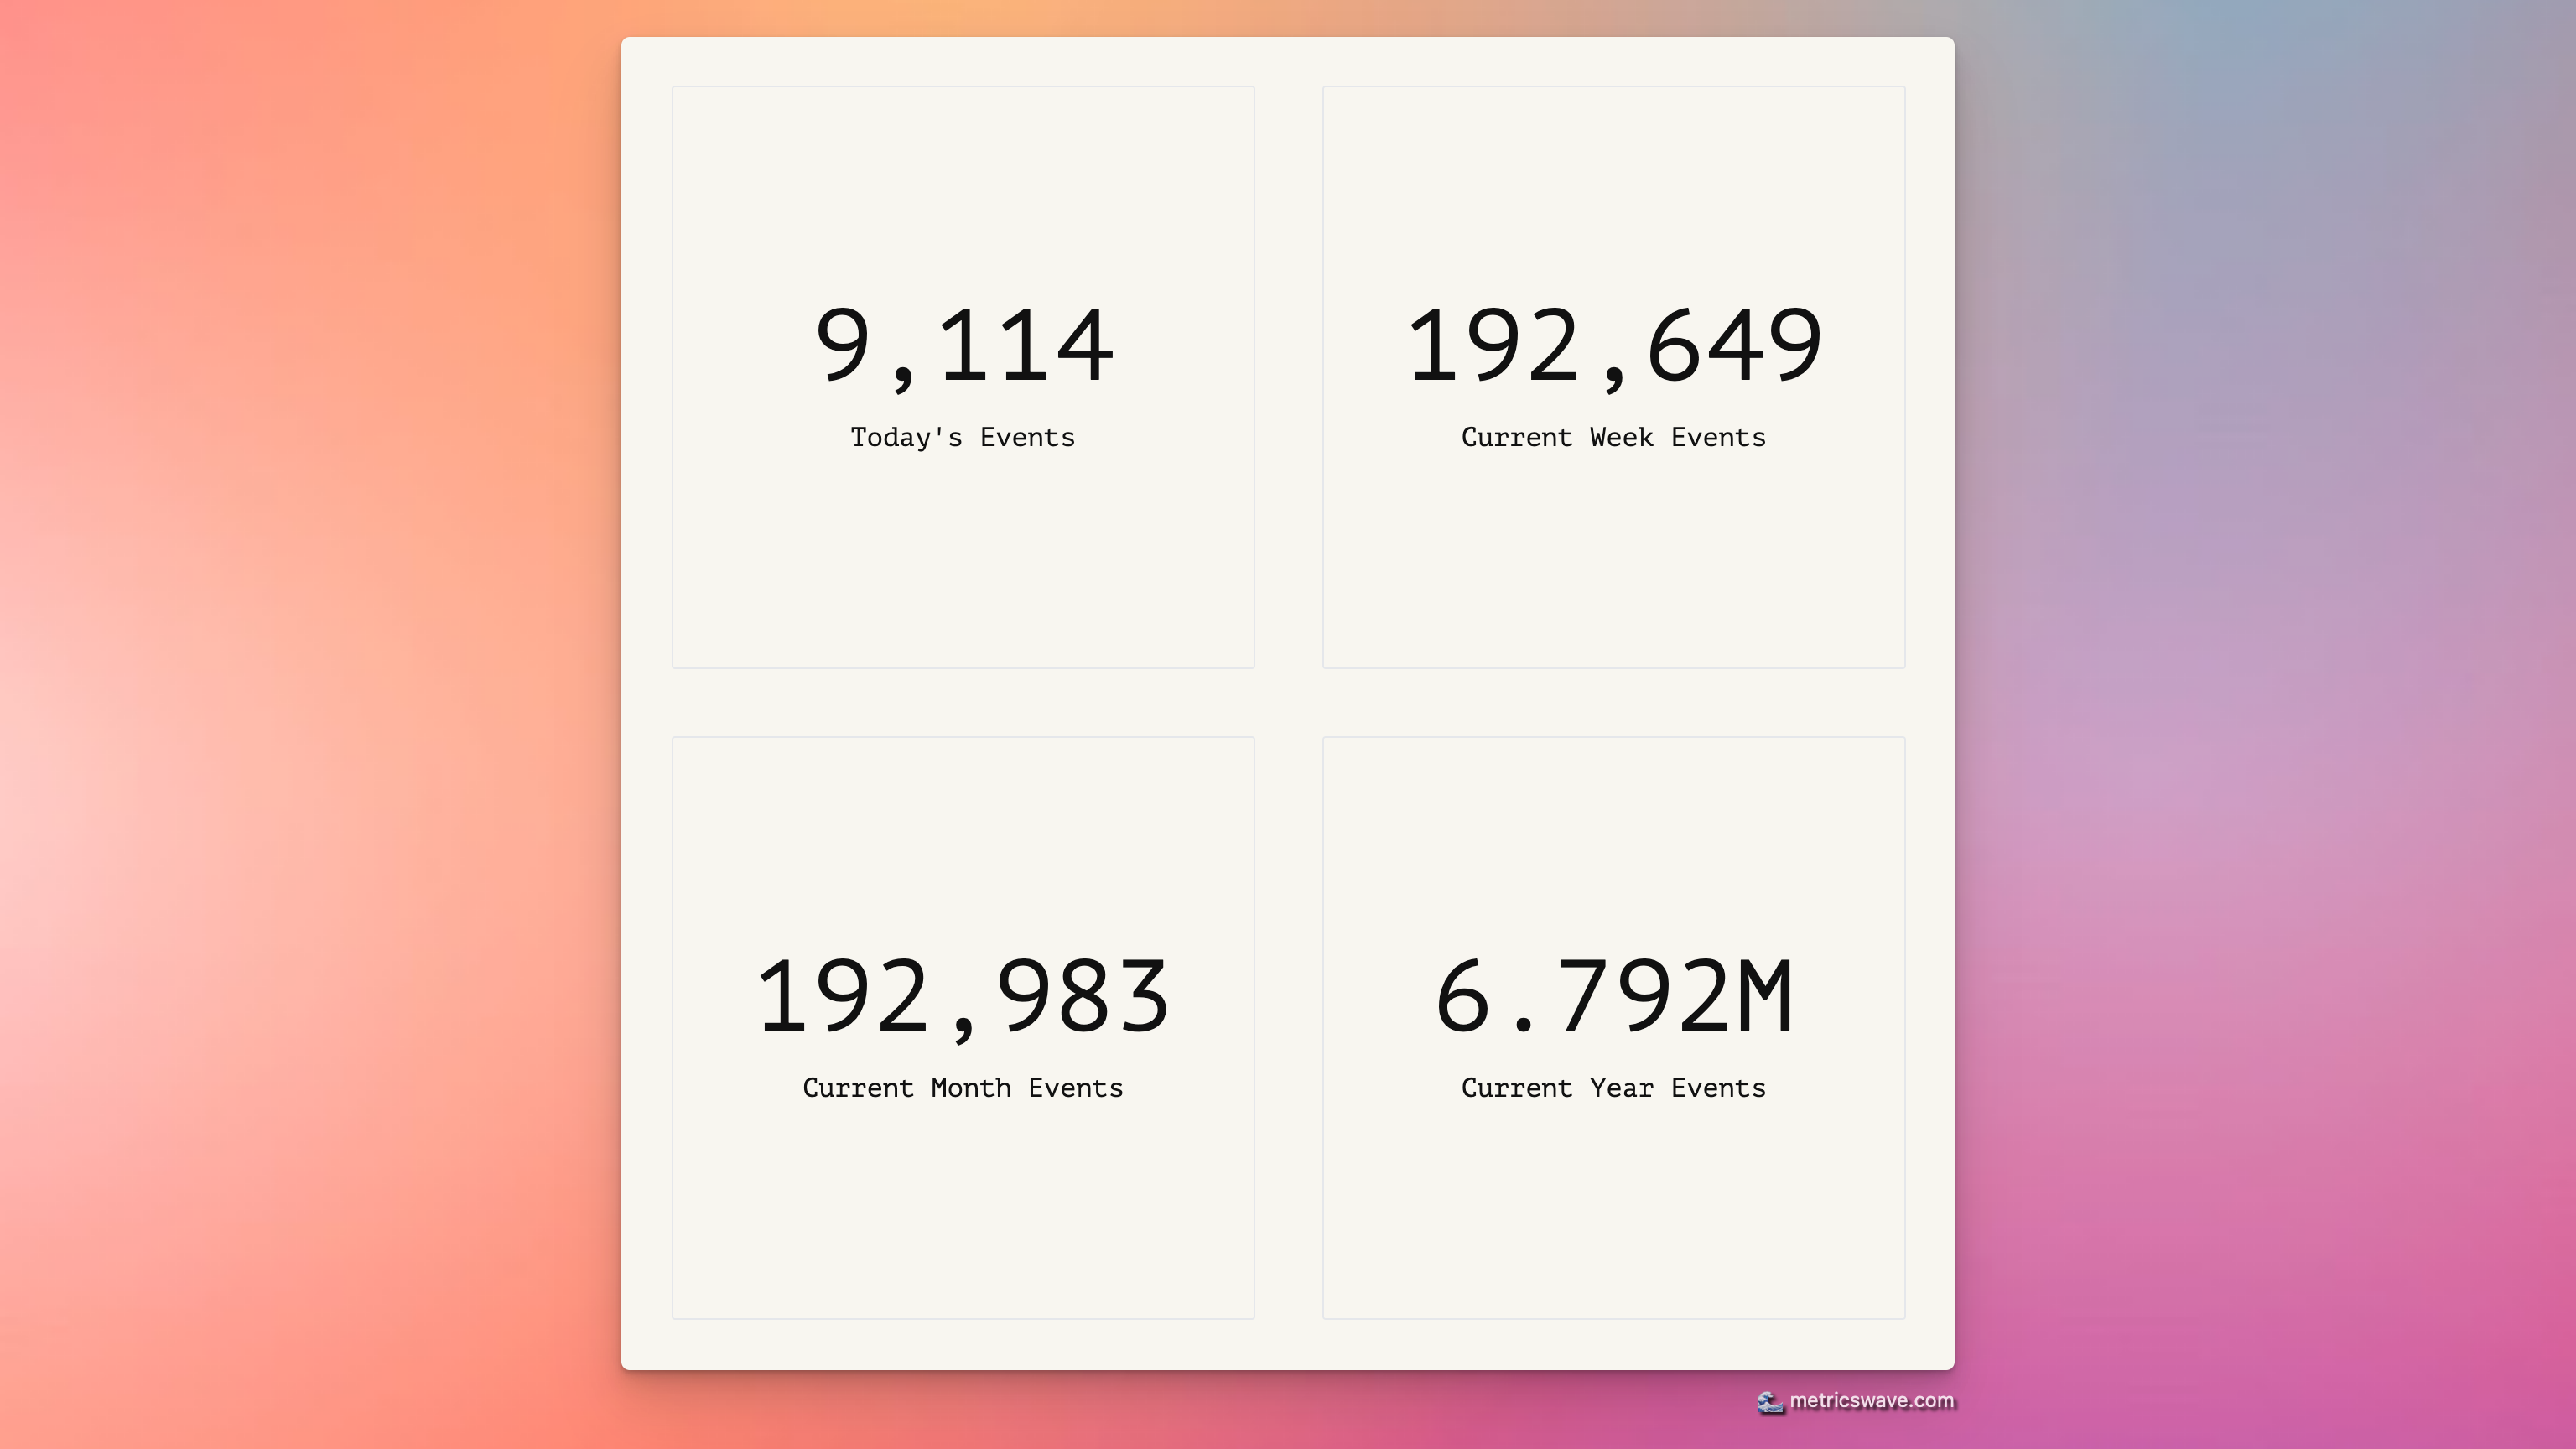
This year, MetricsWave is growing a lot. The number of events has 3x in the last months, and we still run in an small server. Even that the service still have 99% uptime, our dashboards performance decreased and the experience was not good enough, until today.
Changelog: New trigger view, with more details and filters
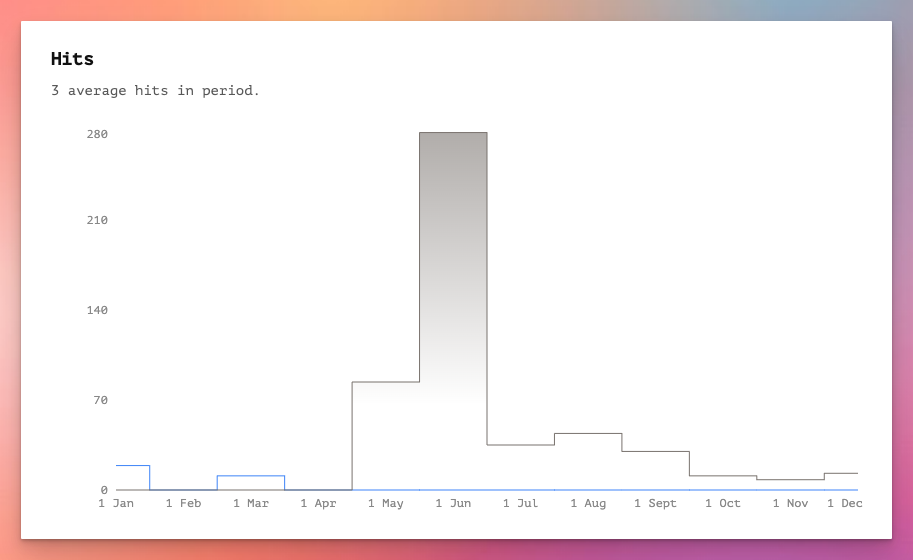
Sometimes you want to see one trigger details and stats without adding it to the dashboard. This update is based on your feedback.